miscellaneous/live_plot.py
Description
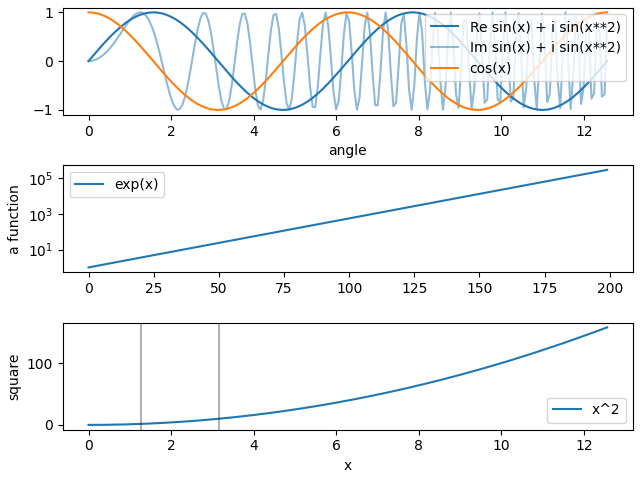
Live plot demonstration.
Usage Example
Run and plot two logs on the fly:
python3 sfepy/examples/miscellaneous/live_plot.py --plot-log
Run and store the two logs, plot them later:
python3 sfepy/examples/miscellaneous/live_plot.py

python3 sfepy/scripts/plot_logs.py live_plot.txt
python3 sfepy/scripts/plot_logs.py live_plot2.txt
"""
Live plot demonstration.
Usage Example
-------------
- Run and plot two logs on the fly::
python3 sfepy/examples/miscellaneous/live_plot.py --plot-log
- Run and store the two logs, plot them later::
python3 sfepy/examples/miscellaneous/live_plot.py
python3 sfepy/scripts/plot_logs.py live_plot.txt
python3 sfepy/scripts/plot_logs.py live_plot2.txt
"""
from argparse import ArgumentParser, RawDescriptionHelpFormatter
import os.path as op
from functools import partial
import numpy as nm
from sfepy.base.base import output, pause
from sfepy.base.log import Log
def main():
parser = ArgumentParser(description=__doc__.rstrip(),
formatter_class=RawDescriptionHelpFormatter)
parser.add_argument('-o', '--output-dir', default='.',
help='output directory')
parser.add_argument( '-p', '--plot-log', action='store_true',
default=False, help='show live log figures')
options = parser.parse_args()
inodir = partial(op.join, options.output_dir)
log = Log((['sin(x) + i sin(x**2)', 'cos(x)'], ['exp(x)'], ['x^2']),
yscales=['linear', 'log', 'linear'],
xlabels=['angle', None, 'x'],
ylabels=[None, 'a function', 'square'],
aggregate=1000, sleep=0.05,
is_plot=options.plot_log,
log_filename=inodir('live_plot.txt'))
# Plot groups can be added on the fly but then they are missing in the log
# header - sfepy/scripts/plot_logs.py cannot plot them.
# log.add_group(['x^2'], yscale='linear', xlabel='new x',
# ylabel='square', formats=['%+g'])
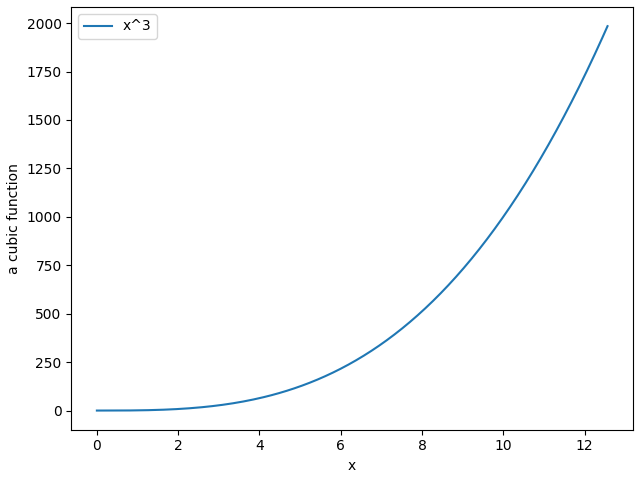
log2 = Log([['x^3']],
yscales=['linear'],
xlabels=['x'], ylabels=['a cubic function'],
aggregate=1000, sleep=0.05,
is_plot=options.plot_log,
log_filename=inodir('live_plot2.txt'),
formats=[['{:.5e}']])
for ii, x in enumerate(nm.linspace(0, 4.0 * nm.pi, 200)):
output('x: ', x)
log(nm.sin(x)+1j*nm.sin(x**2), nm.cos(x), nm.exp(x), x**2,
x=[x, None, x])
if (ii == 20) or (ii == 50):
log.plot_vlines([2], color='g', linewidth=2)
log2(x**3, x=[x])
print(log)
print(log2)
log(save_figure=inodir('live_plot.png'))
log2(save_figure=inodir('live_plot2.png'))
if options.plot_log:
pause()
log(finished=True)
log2(finished=True)
if __name__ == '__main__':
main()