linear_elasticity/its2D_4.py
Description
Diametrically point loaded 2-D disk with postprocessing and probes. See Primer.
solve the problem:
sfepy-run sfepy/examples/linear_elasticity/its2D_4.py
optionally, view the results:
sfepy-view its2D.h5 -2
optionally, convert results to VTK, and view again ((assumes running from the sfepy directory):
python3 sfepy/scripts/extractor.py -d its2D.h5 sfepy-view its2D.0.vtk -2
probe the data:
sfepy-probe sfepy/examples/linear_elasticity/its2D_4.py its2D.h5
Find  such that:
where

r"""
Diametrically point loaded 2-D disk with postprocessing and probes. See
:ref:`sec-primer`.
1. solve the problem::
sfepy-run sfepy/examples/linear_elasticity/its2D_4.py
2. optionally, view the results::
sfepy-view its2D.h5 -2
3. optionally, convert results to VTK, and view again ((assumes running from
the sfepy directory)::
python3 sfepy/scripts/extractor.py -d its2D.h5
sfepy-view its2D.0.vtk -2
4. probe the data::
sfepy-probe sfepy/examples/linear_elasticity/its2D_4.py its2D.h5
Find :math:`\ul{u}` such that:
.. math::
\int_{\Omega} D_{ijkl}\ e_{ij}(\ul{v}) e_{kl}(\ul{u})
= 0
\;, \quad \forall \ul{v} \;,
where
.. math::
D_{ijkl} = \mu (\delta_{ik} \delta_{jl}+\delta_{il} \delta_{jk}) +
\lambda \ \delta_{ij} \delta_{kl}
\;.
"""
from sfepy.examples.linear_elasticity.its2D_1 import *
from sfepy.mechanics.matcoefs import stiffness_from_youngpoisson
def stress_strain(out, pb, state, extend=False):
"""
Calculate and output strain and stress for given displacements.
"""
from sfepy.base.base import Struct
ev = pb.evaluate
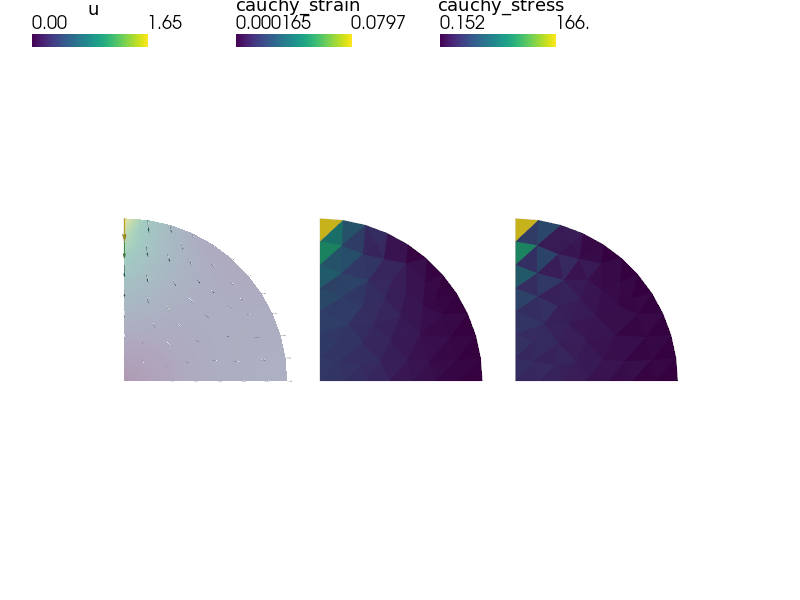
strain = ev('ev_cauchy_strain.2.Omega(u)', mode='el_avg')
stress = ev('ev_cauchy_stress.2.Omega(Asphalt.D, u)', mode='el_avg')
out['cauchy_strain'] = Struct(name='output_data', mode='cell',
data=strain, dofs=None)
out['cauchy_stress'] = Struct(name='output_data', mode='cell',
data=stress, dofs=None)
return out
def gen_lines(problem):
from sfepy.discrete.probes import LineProbe
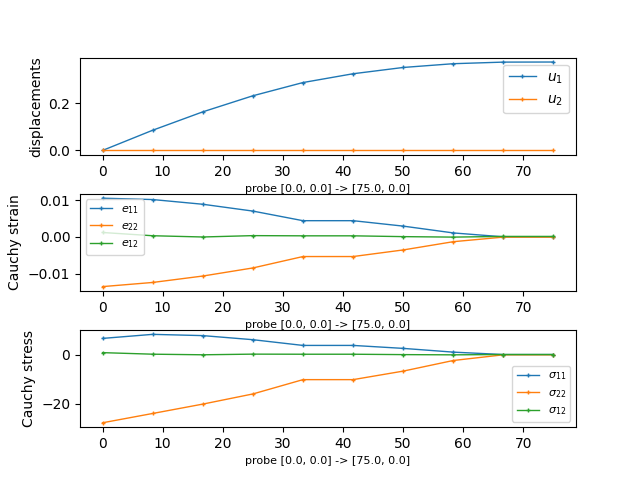
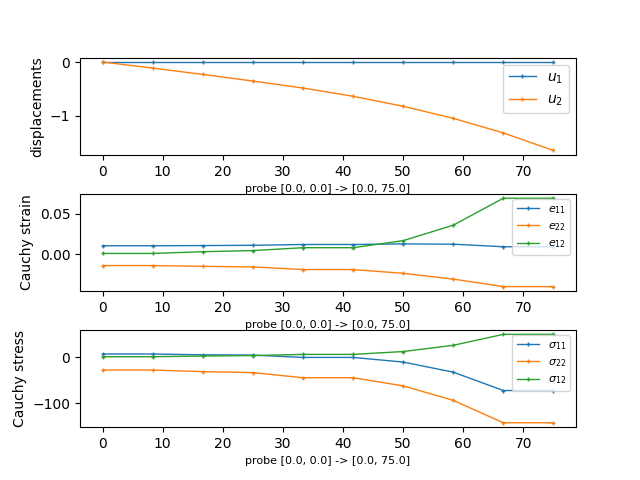
ps0 = [[0.0, 0.0], [ 0.0, 0.0]]
ps1 = [[75.0, 0.0], [ 0.0, 75.0]]
# Use adaptive probe with 10 inital points.
n_point = -10
labels = ['%s -> %s' % (p0, p1) for p0, p1 in zip(ps0, ps1)]
probes = []
for ip in range(len(ps0)):
p0, p1 = ps0[ip], ps1[ip]
probes.append(LineProbe(p0, p1, n_point))
return probes, labels
def probe_hook(data, probe, label, problem):
import matplotlib.pyplot as plt
import matplotlib.font_manager as fm
def get_it(name, var_name):
var = problem.create_variables([var_name])[var_name]
var.set_data(data[name].data)
pars, vals = probe(var)
vals = vals.squeeze()
return pars, vals
results = {}
results['u'] = get_it('u', 'u')
results['cauchy_strain'] = get_it('cauchy_strain', 's')
results['cauchy_stress'] = get_it('cauchy_stress', 's')
fig = plt.figure()
plt.clf()
fig.subplots_adjust(hspace=0.4)
plt.subplot(311)
pars, vals = results['u']
for ic in range(vals.shape[1]):
plt.plot(pars, vals[:,ic], label=r'$u_{%d}$' % (ic + 1),
lw=1, ls='-', marker='+', ms=3)
plt.ylabel('displacements')
plt.xlabel('probe %s' % label, fontsize=8)
plt.legend(loc='best', prop=fm.FontProperties(size=10))
sym_indices = ['11', '22', '12']
plt.subplot(312)
pars, vals = results['cauchy_strain']
for ic in range(vals.shape[1]):
plt.plot(pars, vals[:,ic], label=r'$e_{%s}$' % sym_indices[ic],
lw=1, ls='-', marker='+', ms=3)
plt.ylabel('Cauchy strain')
plt.xlabel('probe %s' % label, fontsize=8)
plt.legend(loc='best', prop=fm.FontProperties(size=8))
plt.subplot(313)
pars, vals = results['cauchy_stress']
for ic in range(vals.shape[1]):
plt.plot(pars, vals[:,ic], label=r'$\sigma_{%s}$' % sym_indices[ic],
lw=1, ls='-', marker='+', ms=3)
plt.ylabel('Cauchy stress')
plt.xlabel('probe %s' % label, fontsize=8)
plt.legend(loc='best', prop=fm.FontProperties(size=8))
return plt.gcf(), results
materials['Asphalt'][0].update({'D' : stiffness_from_youngpoisson(2, young, poisson)})
# Update fields and variables to be able to use probes for tensors.
fields.update({
'sym_tensor': ('real', 3, 'Omega', 0),
})
variables.update({
's' : ('parameter field', 'sym_tensor', None),
})
options.update({
'output_format' : 'h5', # VTK reader cannot read cell data yet for probing
'post_process_hook' : 'stress_strain',
'gen_probes' : 'gen_lines',
'probe_hook' : 'probe_hook',
})