phononic/band_gaps.py
Description
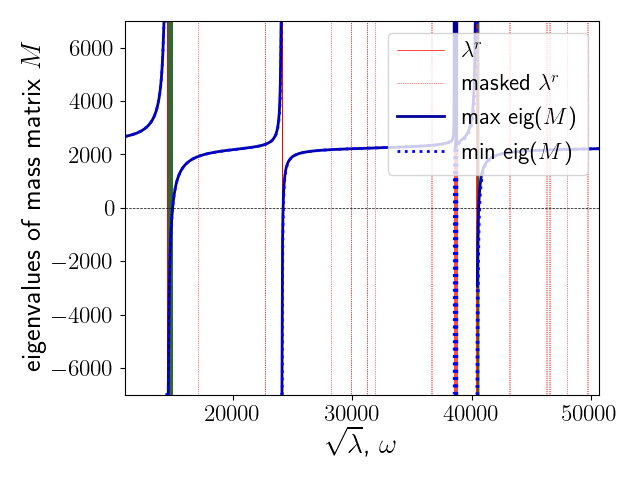
Acoustic band gaps in a strongly heterogeneous elastic body, detected using homogenization techniques.
A reference periodic cell contains two domains: the stiff matrix  and the soft (but heavy) inclusion
  .
.
"""
Acoustic band gaps in a strongly heterogeneous elastic body, detected using
homogenization techniques.
A reference periodic cell contains two domains: the stiff matrix :math:`Y_m`
and the soft (but heavy) inclusion :math:`Y_c`.
"""
from sfepy import data_dir
from sfepy.base.base import Struct
from sfepy.base.ioutils import InDir
from sfepy.homogenization.coefficients import Coefficients
from sfepy.examples.phononic.band_gaps_conf import (BandGapsConf, get_pars,
clip, clip_sqrt)
clip, clip_sqrt # Make pyflakes happy...
incwd = InDir(__file__)
filename = data_dir + '/meshes/2d/special/circle_in_square.mesh'
output_dir = incwd('output/band_gaps')
# aluminium, SI units
D_m = get_pars(2, 5.898e10, 2.681e10)
density_m = 2799.0
# epoxy, SI units
D_c = get_pars(2, 1.798e9, 1.48e9)
density_c = 1142.0
mat_pars = Coefficients(D_m=D_m, density_m=density_m,
D_c=D_c, density_c=density_c)
region_selects = Struct(matrix='cells of group 1',
inclusion='cells of group 2')
corrs_save_names = {'evp' : 'evp', 'corrs_rs' : 'corrs_rs'}
options = {
'plot_transform_angle' : None,
'plot_transform_wave' : ('clip_sqrt', (0, 7000)),
'plot_transform' : ('clip', (-7000, 7000)),
'fig_name' : 'band_gaps',
'fig_name_angle' : 'band_gaps_angle',
'fig_name_wave' : 'band_gaps_wave',
'fig_suffix' : '.pdf',
'coefs_filename' : 'coefs.txt',
'incident_wave_dir' : [1.0, 1.0],
'plot_options' : {
'show' : True,
'legend' : True,
},
'plot_labels' : {
'band_gaps' : {
'resonance' : r'$\lambda^r$',
'masked' : r'masked $\lambda^r$',
'eig_min' : r'min eig($M$)',
'eig_max' : r'max eig($M$)',
'x_axis' : r'$\sqrt{\lambda}$, $\omega$',
'y_axis' : r'eigenvalues of mass matrix $M$',
},
},
'plot_rsc' : {
'params' : {'axes.labelsize': 'x-large',
'font.size': 14,
'legend.fontsize': 'large',
'legend.loc': 'upper right',
'xtick.labelsize': 'large',
'ytick.labelsize': 'large',
'text.usetex': True},
},
'multiprocessing' : False,
'float_format' : '%.16e',
}
evp_options = {
'eigensolver' : 'eig.sgscipy',
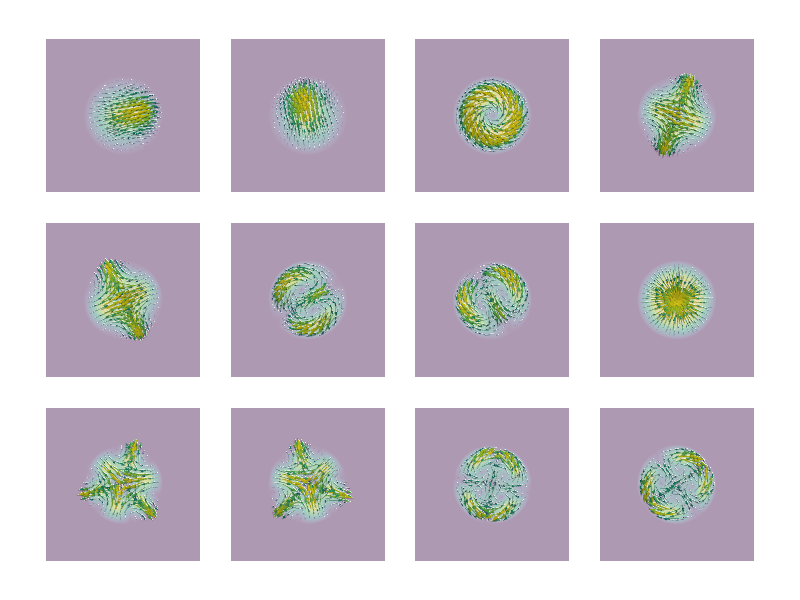
'save_eig_vectors' : (12, 0),
'scale_epsilon' : 1.0,
'elasticity_contrast' : 1.0,
}
eigenmomenta_options = {
# eigenmomentum threshold,
'threshold' : 1e-2,
# eigenmomentum threshold is relative w.r.t. largest one,
'threshold_is_relative' : True,
}
band_gaps_options = {
'eig_range' : (0, 30), # -> freq_range
# = sqrt(eigs[slice(*eig_range)][[0, -1]])
# 'fixed_freq_range' : (0.1, 3e7),
'freq_margins' : (10, 10), # % of freq_range
'freq_eps' : 1e-7, # frequency
'zero_eps' : 1e-12, # zero finding
'freq_step' : 0.0001, # % of freq_range
'log_save_name' : 'band_gaps.log',
'raw_log_save_name' : 'raw_eigensolution.npz',
}
conf = BandGapsConf(filename, 1, region_selects, mat_pars, options,
evp_options, eigenmomenta_options, band_gaps_options,
corrs_save_names=corrs_save_names, incwd=incwd,
output_dir=output_dir)
define = lambda: conf.conf.to_dict()